Contents
clear all; close all;
Read Channel data
data location
url='http://ustb.no/datasets/';      % if not found downloaded from here
filename = 'FieldII_STAI_uniform_fov.uff';

% checks if the data is in your data path, and downloads it otherwise.
% The defaults data path is under USTB's folder, but you can change this
% by setting an environment variable with setenv(DATA_PATH,'the_path_you_want_to_use');
tools.download(filename, url, data_path);

channel_data = uff.channel_data();
channel_data.read([data_path filesep filename],'/channel_data_speckle');
UFF: reading channel_data_speckle [uff.channel_data]
UFF: reading sequence [uff.wave] [====================] 100%
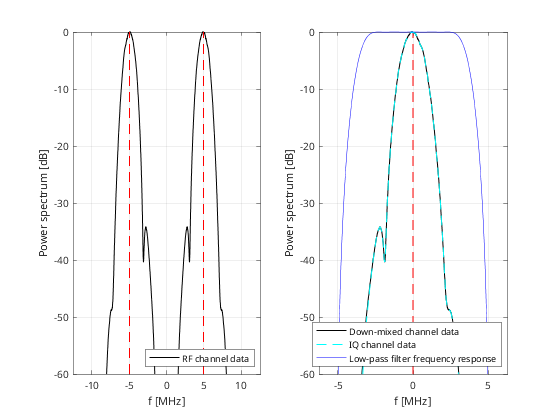
Demodulation
demod = preprocess.fast_demodulation();
demod.plot_on = true;
demod.input = channel_data;
channel_data_demod = demod.go();
Warning: The modulation frequency is not specified. The estimated central
frequency will be used.
Estimating power spectrum
Warning: The downsampling frequency is not specified. Using 2 *
modulation_frequency.
Warning: The input sample frequency is not a multiple of the specified
downsample frequency. Rounding up the downsample frequency to the next higher
downsample frequency.
Low-pass filtering
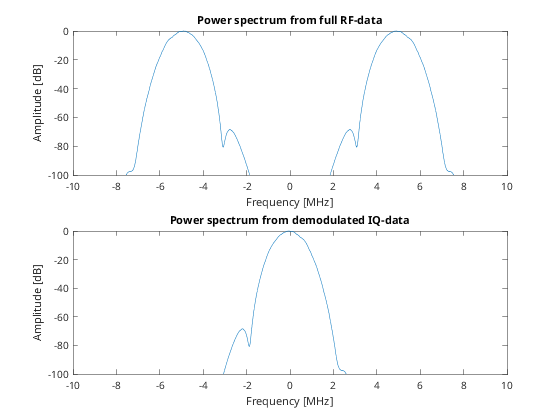
Estimate power spectrums
[fx, F] = tools.power_spectrum(channel_data.data,channel_data.sampling_frequency);
[fx_demod, F_demod] = tools.power_spectrum(channel_data_demod.data,channel_data_demod.sampling_frequency);
Display the different power spectrums
figure(1);
subplot(211)
plot(fx*10^-6,db(F));
xlim([-10 10]);ylim([-100 0])
xlabel('Frequency [MHz]');ylabel('Amplitude [dB]');
title('Power spectrum from full RF-data');
subplot(212)
plot(fx_demod*10^-6,db(F_demod));
xlim([-10 10]);ylim([-100 0])
xlabel('Frequency [MHz]');ylabel('Amplitude [dB]');
title('Power spectrum from demodulated IQ-data');
Define the scan
sca=uff.linear_scan('x_axis',linspace(channel_data.probe.x(1),channel_data.probe.x(end),512).','z_axis',linspace(2.5e-3,55e-3,512).');
Do DAS beamforming
mid = midprocess.das();
mid.scan = sca;
mid.channel_data = channel_data_demod;
mid.dimension = dimension.both();
mid.receive_apodization.window=uff.window.boxcar;
mid.receive_apodization.f_number=1.75;
mid.transmit_apodization.window=uff.window.boxcar;
mid.transmit_apodization.f_number=1.75;
b_data_demod = mid.go(); % From demod data
mid.channel_data = channel_data;
b_data = mid.go(); % From RF data
USTB MEX C beamformer...Completed in 5.70 seconds.
USTB MEX C beamformer...Completed in 5.25 seconds.
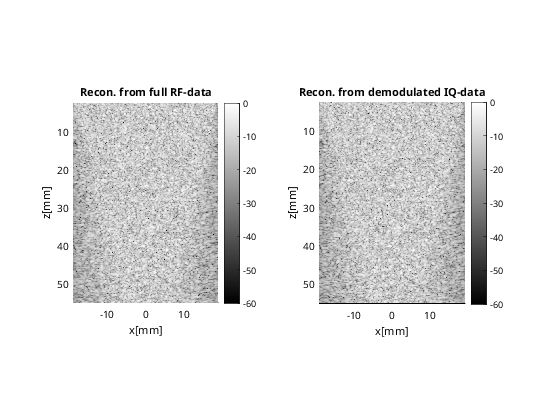
Display both images
figure(2)
b_data_demod.plot(subplot(1,2,1),'Recon. from full RF-data')
b_data.plot(subplot(1,2,2),'Recon. from demodulated IQ-data')
ans =

  Figure (2) with properties:

      Number: 2
        Name: ''
       Color: [1 1 1]
    Position: [323 225 1061 639]
       Units: 'pixels'

  Use GET to show all properties


ans =

  Figure (2) with properties:

      Number: 2
        Name: ''
       Color: [1 1 1]
    Position: [323 225 1061 639]
       Units: 'pixels'

  Use GET to show all properties